Case study · Stock analysis
Inbestplanners
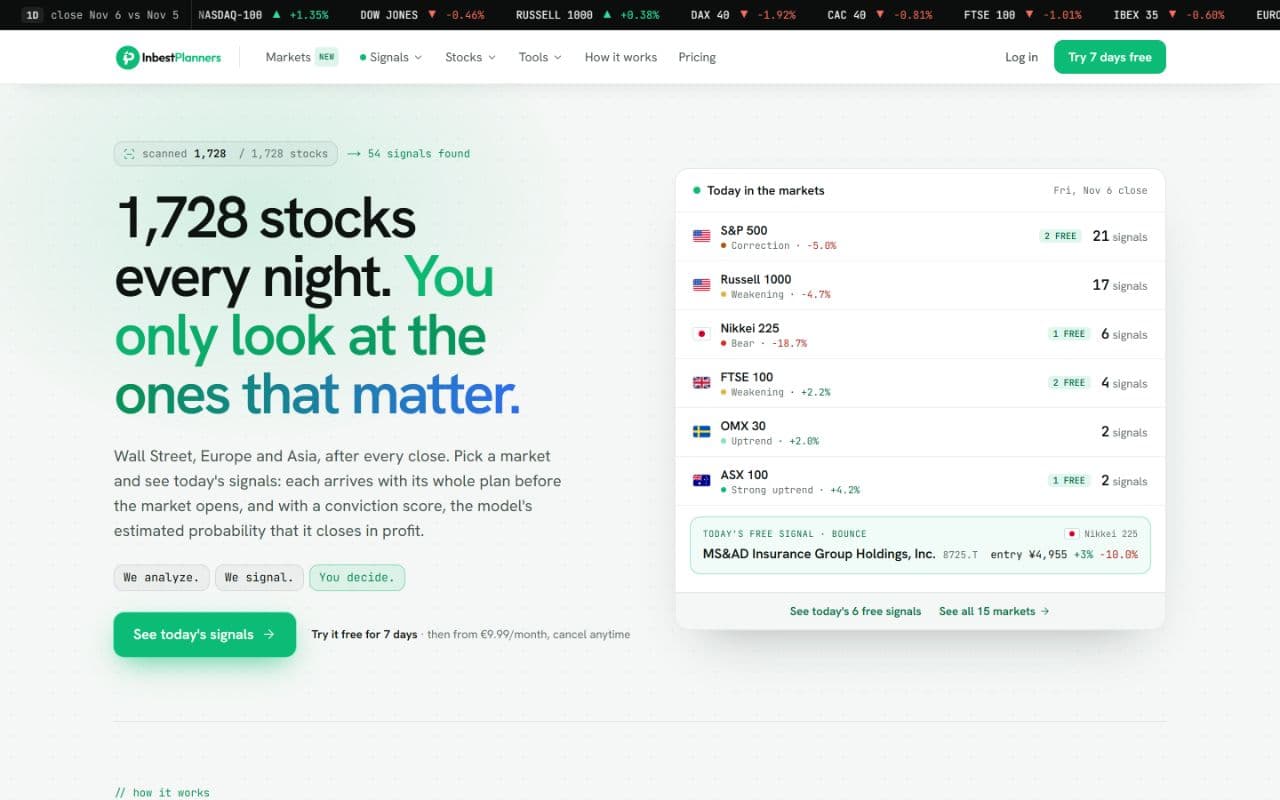
A system that screens 1,700+ stocks every night, issues signals with entry, target and stop, and publishes its results against the S&P 500.
- Industry
- Stock analysis · International
- Our role
- Design, development, hosting and maintenance
- Year
- 2025
- Website
- inbestplanners.com ↗
The problem
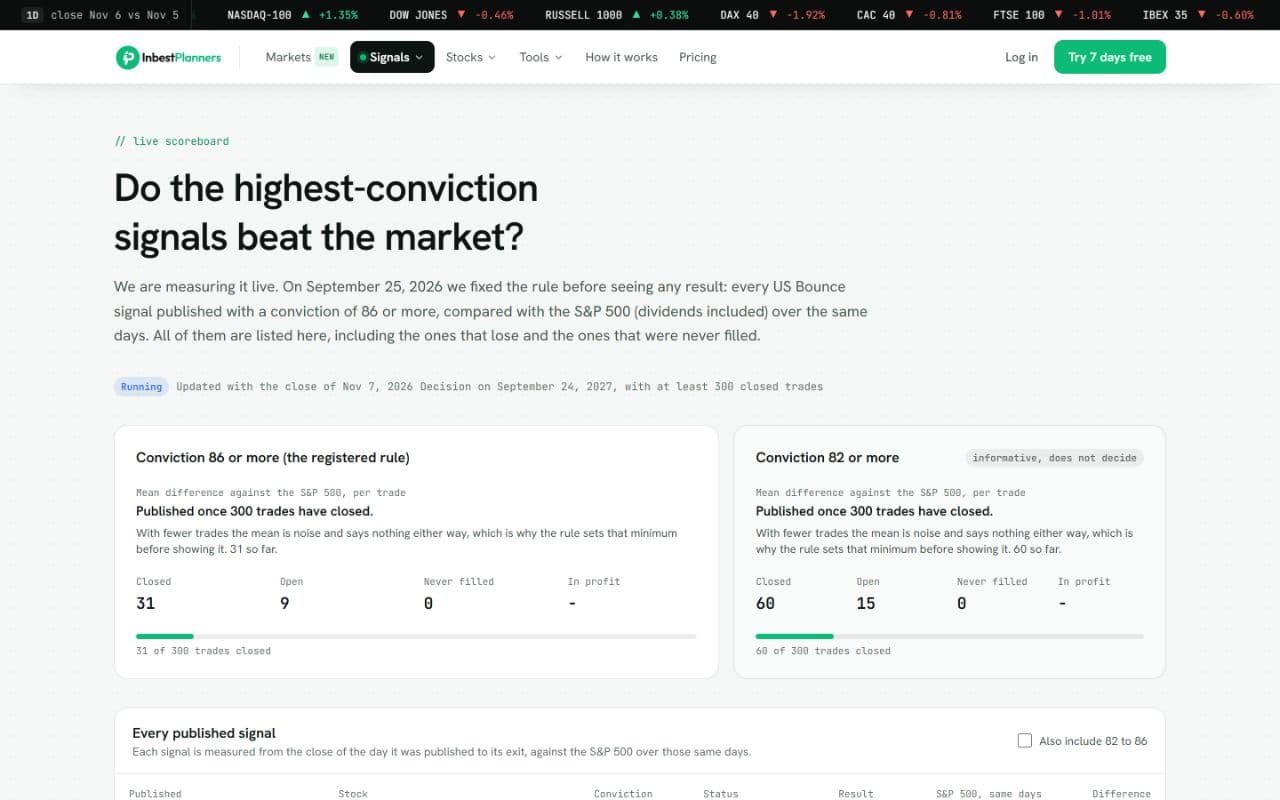
Many stock-signal services only show their wins. Inbestplanners does the opposite: the rule is fixed before any results come in, and every signal goes on a public scoreboard against the S&P 500 — losers included.
What we did
Design
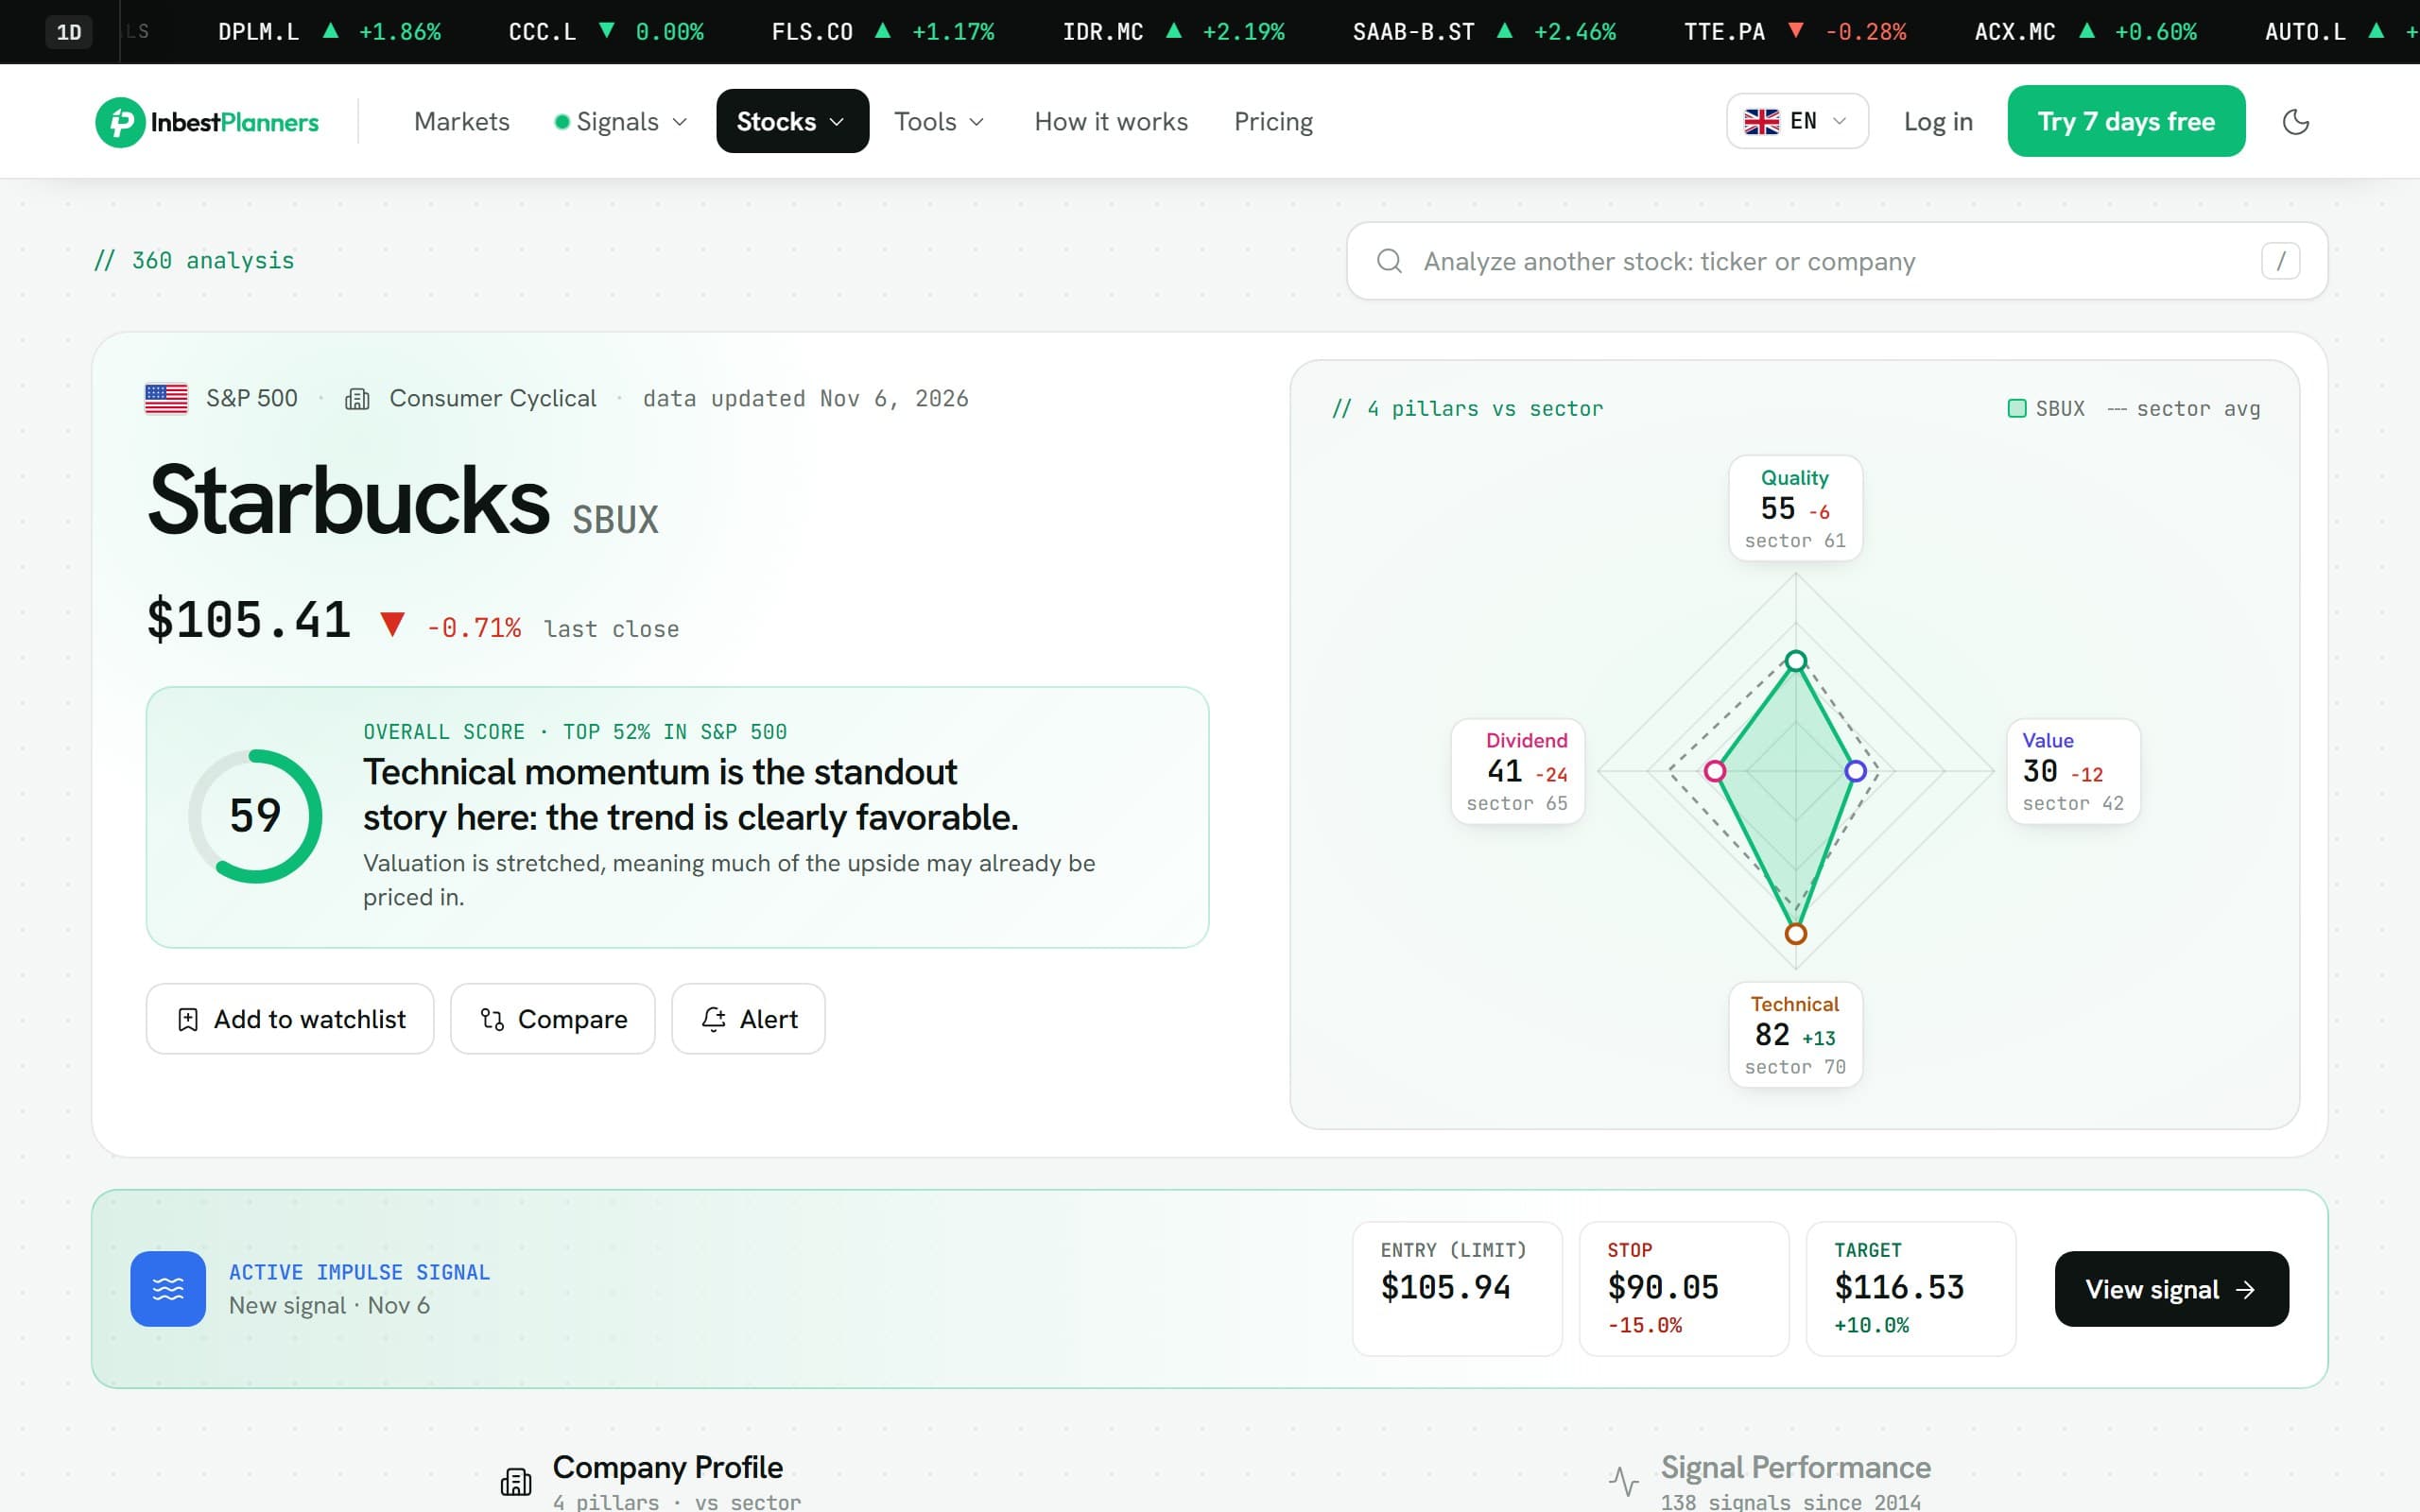
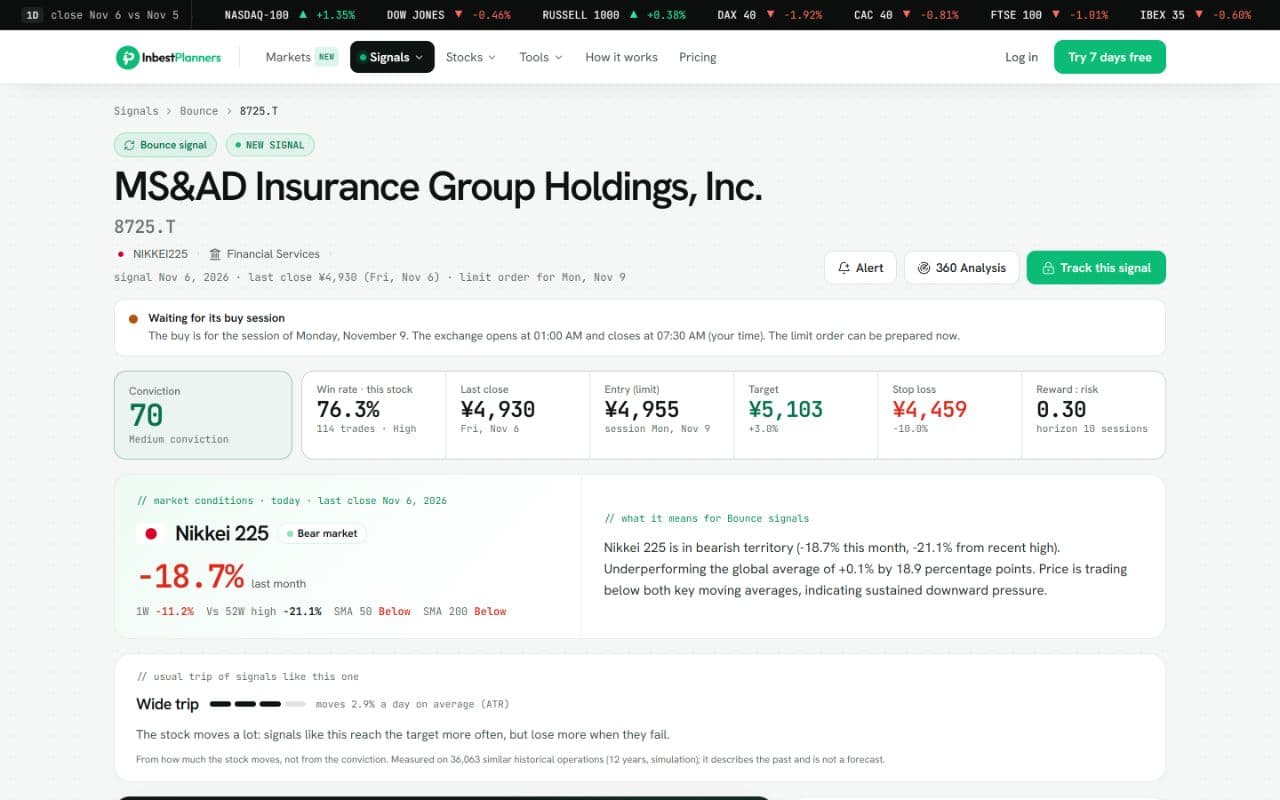
- Signal pages with entry, target, stop and reward-to-risk
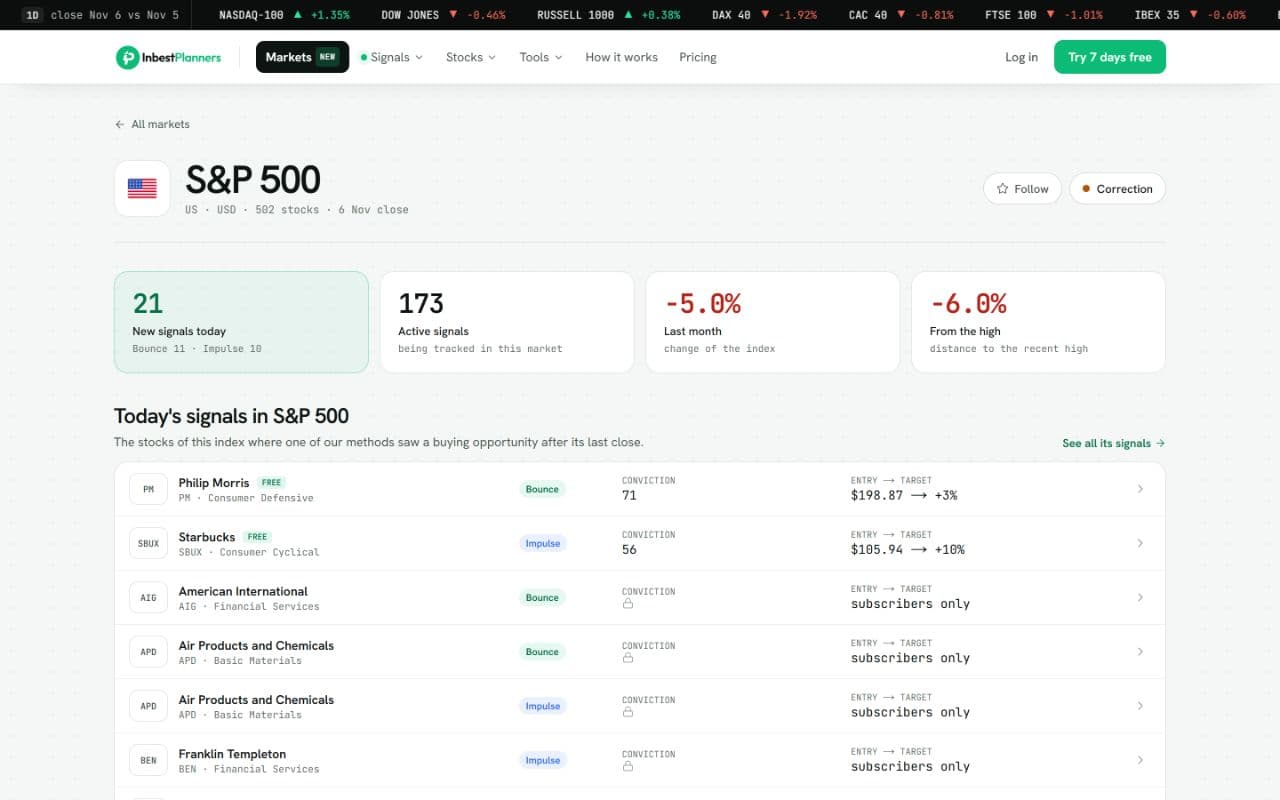
- Public scoreboard and per-market pages
- Interface in English and Spanish
Logic
- Nightly screening of 1,700+ stocks across 15 markets
- Signals with entry, target and stop
- Every signal measured against the S&P 500 over the same days
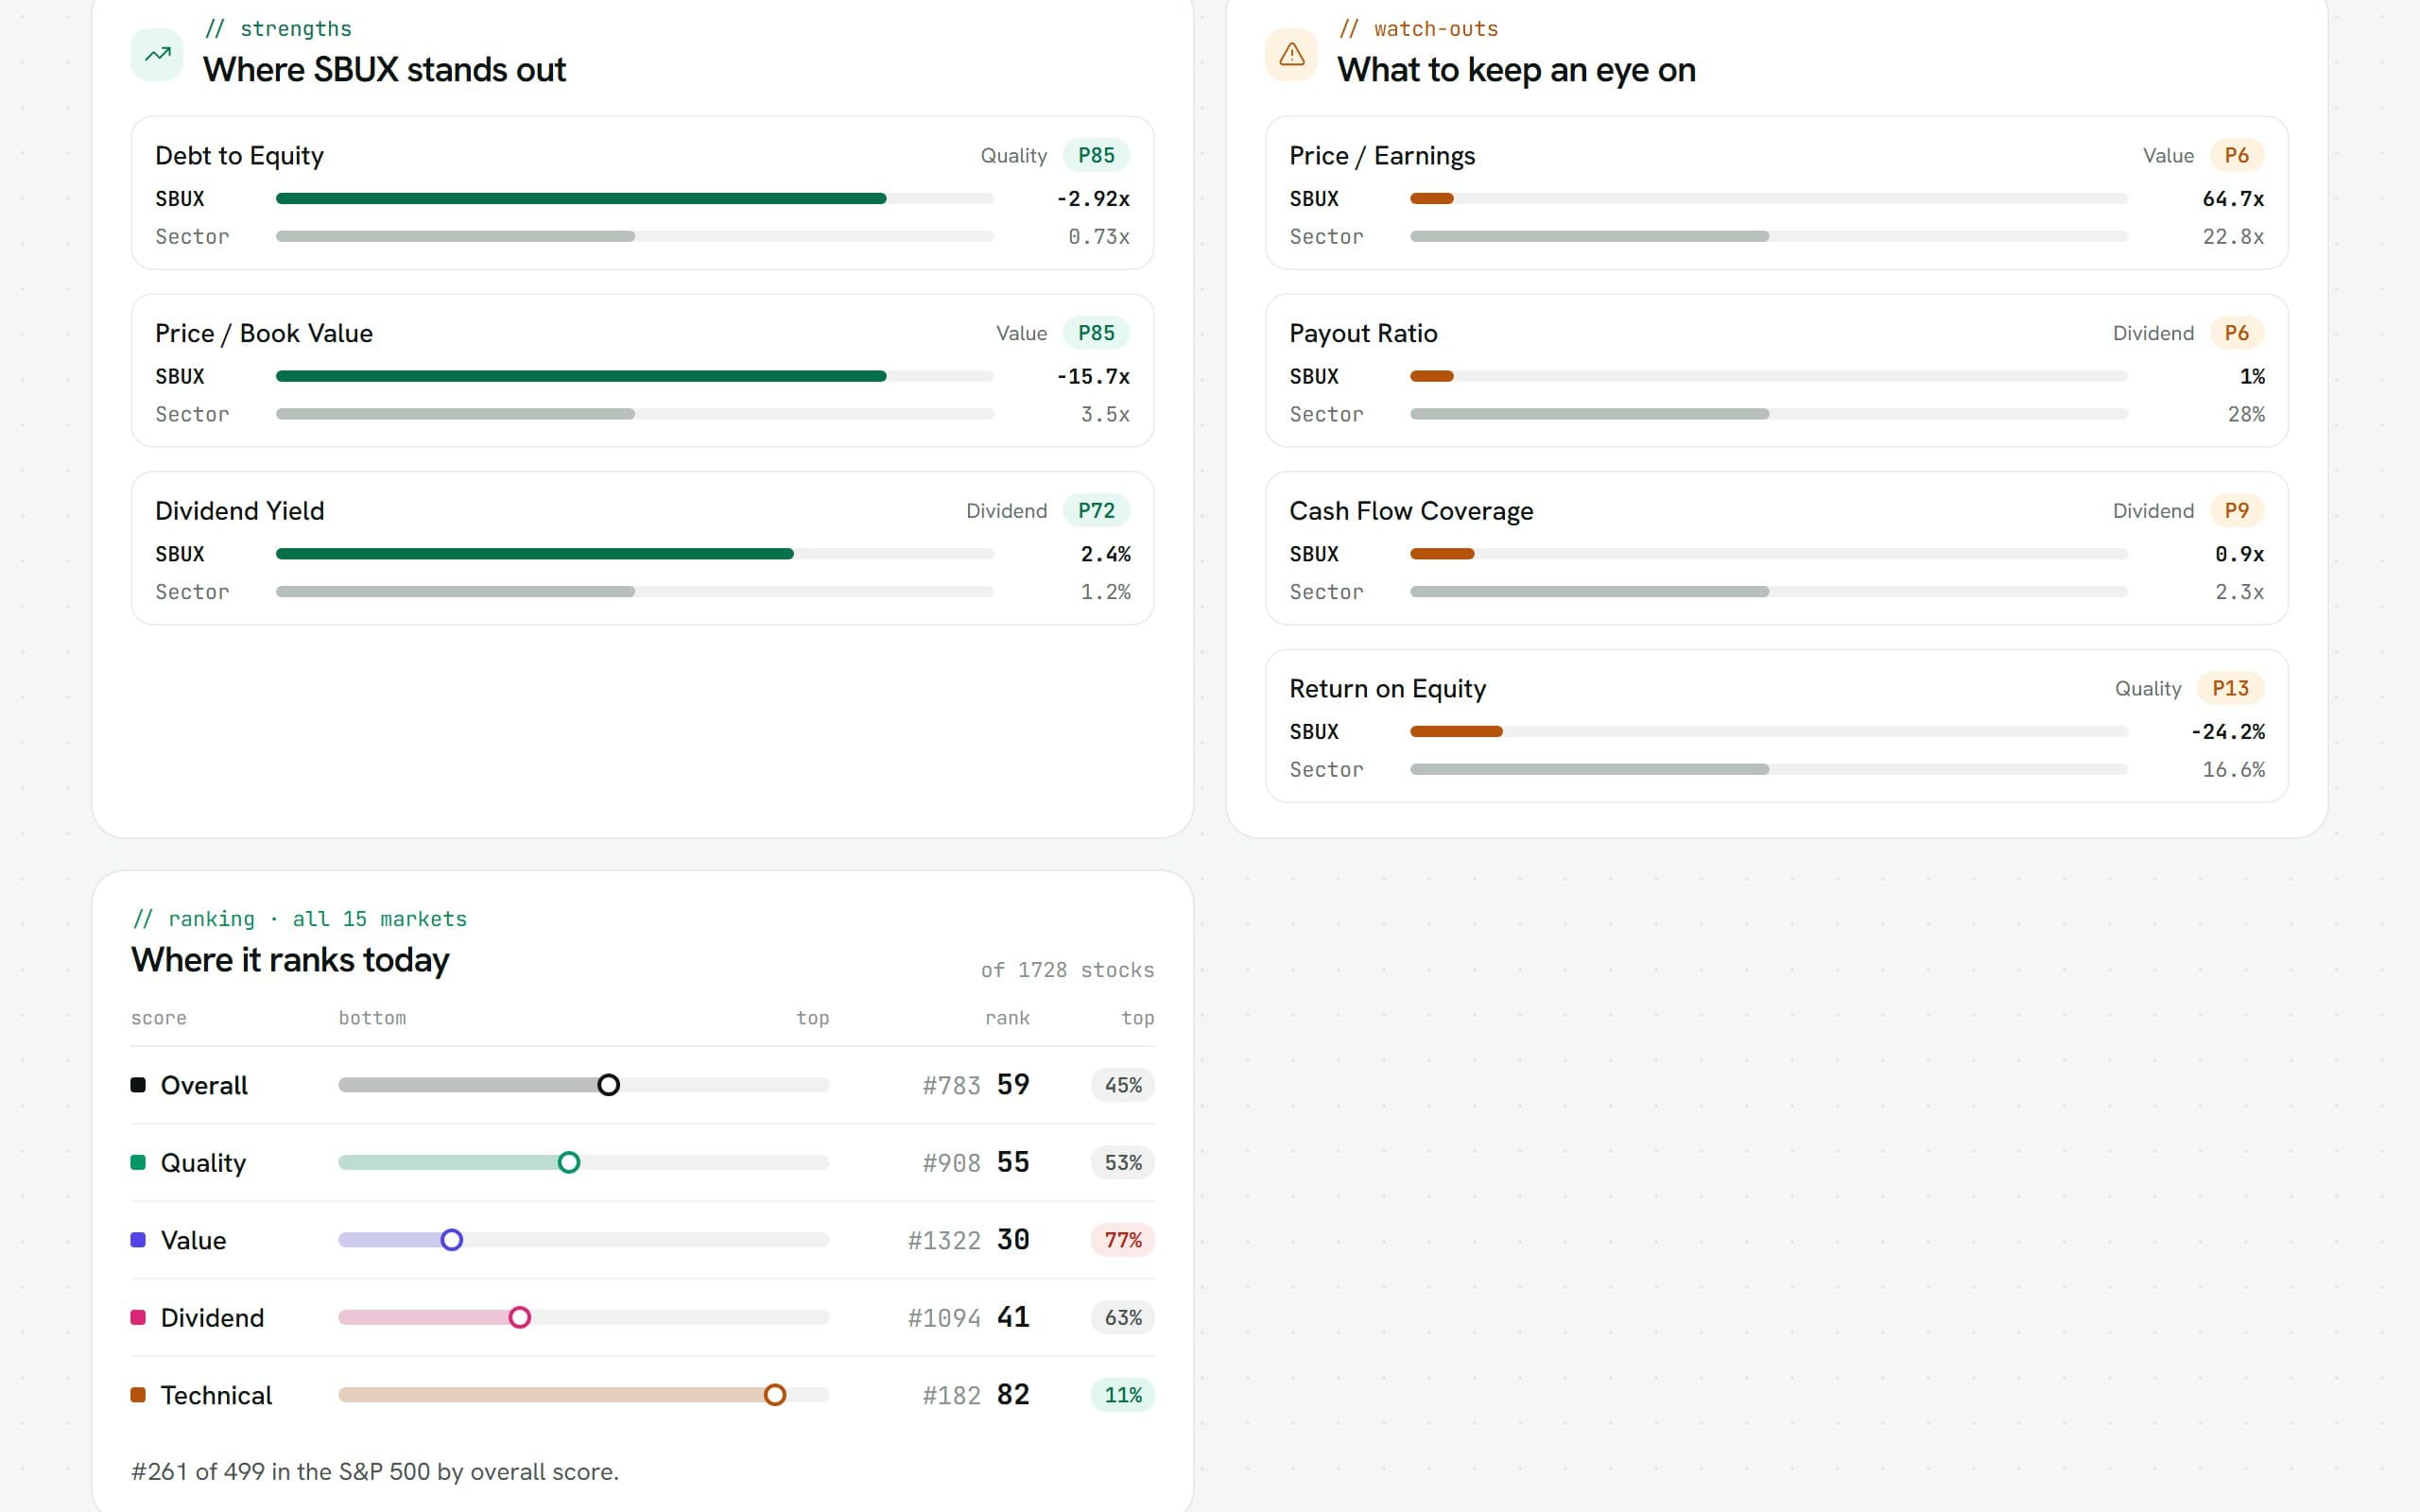
- Rankings
Infrastructure
- Next.js 16 and React 19 with TypeScript, Tailwind 4, next-intl and Recharts charts
- FastAPI with SQLAlchemy, Alembic and PostgreSQL 16
- Redis for rate limiting and session revocation
- Nightly Python analysis (pandas, NumPy, SciPy, scikit-learn) kept apart from the API and monitored with Sentry Crons
- Nginx and Docker on Hetzner
Technical decisions
- The rule comes before the results
- The scoreboard was defined up front and compares every signal with the S&P 500, dividends included, over the same days.
- Everything in the open, losses too
- Every published signal is listed, including the losers and the ones that were never filled.
- Nightly analysis kept apart from the site
- The job that analyses the stocks runs separately from the API, so the site stays fast while it crunches numbers. Sentry Crons alerts us if a run fails or never starts.
- Models trained on a long history
- Two scoring models (logistic regression, 23 features each) trained on 160,000+ simulated trades over roughly 12 years of data.
Screenshots
On the phone, too
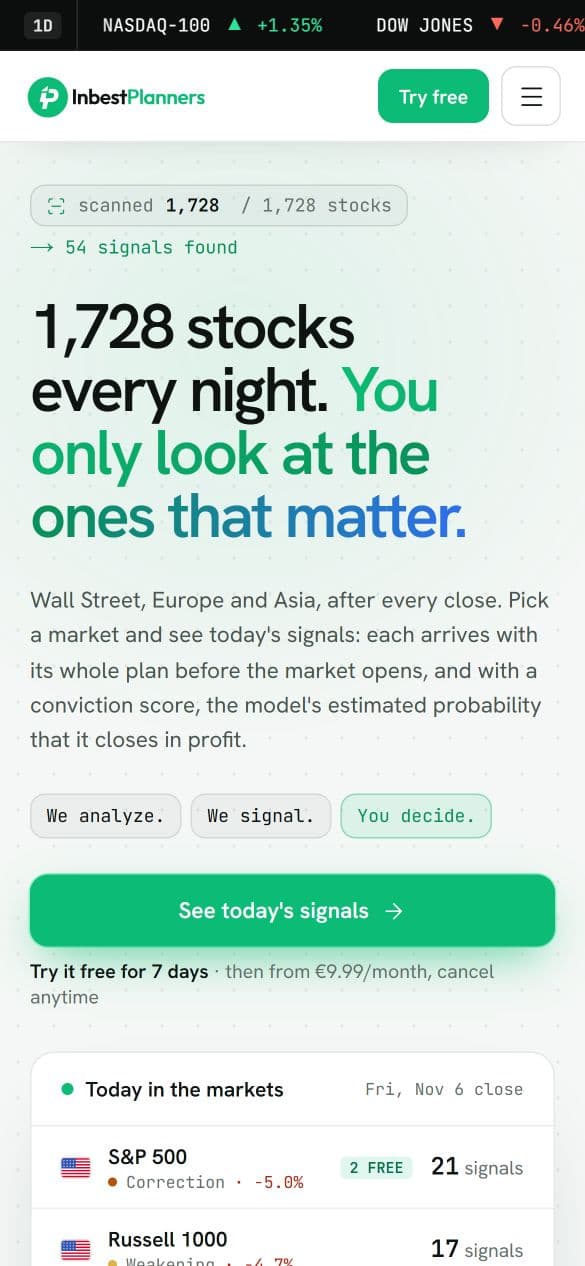
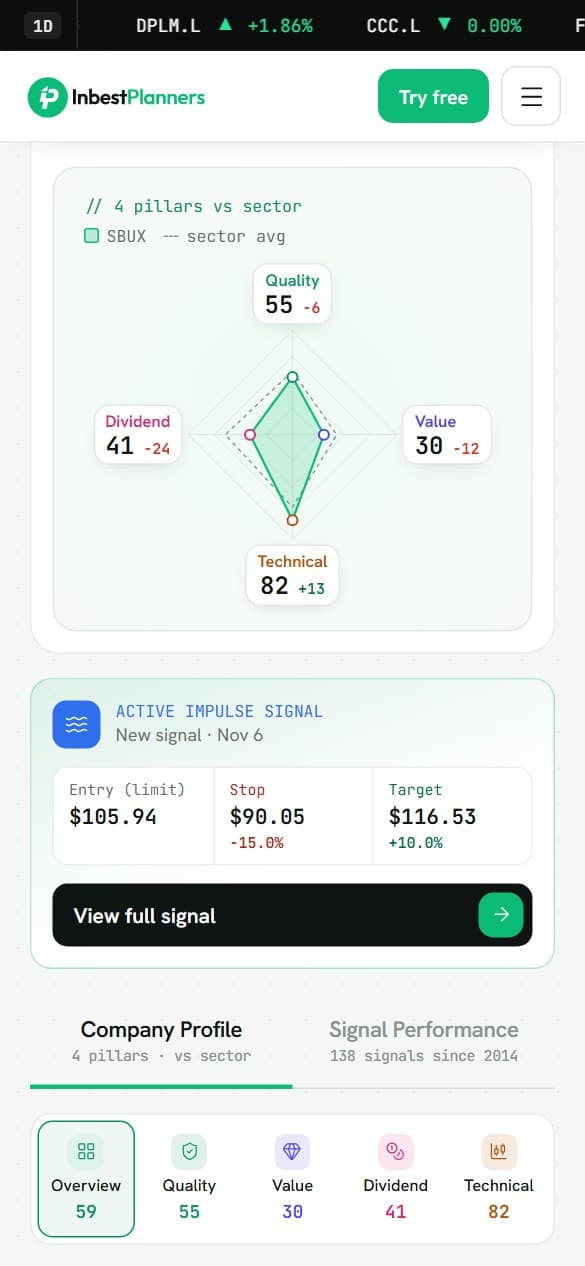
The 360 Analysis, signals and scoreboard, designed to be checked on a phone.
Outcome
The product is live at inbestplanners.com and the scoreboard updates itself after every market close.
- automated tests, including 600+ end-to-end
- 7,700+
- simulated trades over ~12 years of history used to train the models
- 160,000+
- signals published and tracked on the scoreboard since August 2026
- 1,700+
- interface strings translated per language
- 8,000+
Figures checked against the code and production in November 2026.
Visit inbestplanners.com ↗Stack: Next.js 16 · React 19 · TypeScript · Tailwind 4 · next-intl · NextAuth · TanStack Query · Recharts · FastAPI · SQLAlchemy · Alembic · PostgreSQL 16 · Redis · pandas · NumPy · SciPy · scikit-learn · Sentry Crons · Nginx · Docker · Hetzner